-
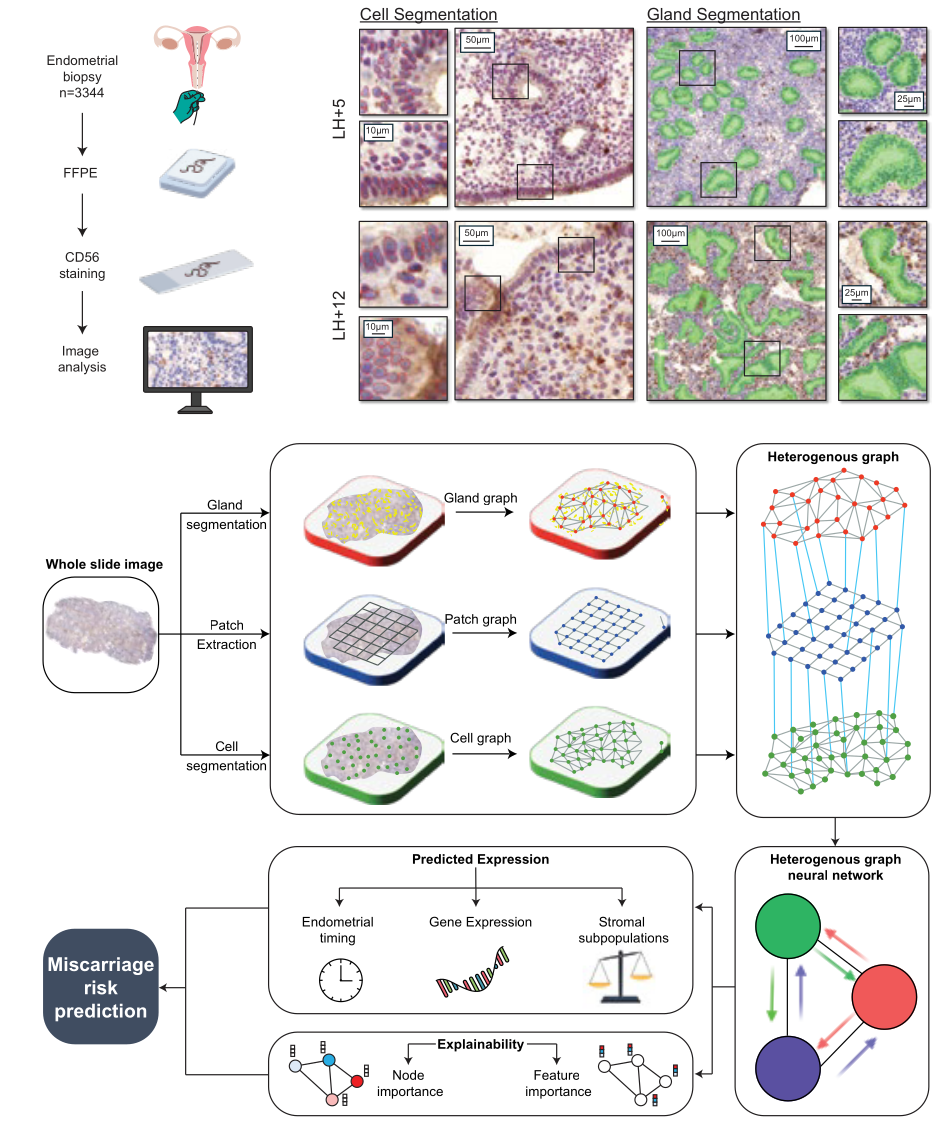
EndoMetronome is a machine learning system which predicts timing, gene expression, and risk of pregnancy loss from luteal phase endometrial biopsies.
This website provides instructions to the visualisation server (below) which is available at: https://tiademos.dcs.warwick.ac.uk/bokeh_app?demo=Endometronome
The website also allows the input of a heterogeneous graph to return predictions for all outputs. For an example graph, please download this file.
For any queries, please contact Fayyaz.Minhas@warwick.ac.uk
George Wright, Tom Rawlings, Joanne Muter, Mark Eastwood, Chow-Seng Kong, Paul Brighton, Jan Brosens, and Fayyaz ul Amir Afsar Minhas. EndoMetronome: Histology Image Based Prediction of Endometrial Timing, Gene Expression, and Miscarriages Reveals Multi-Scale Dysregulation Patterns
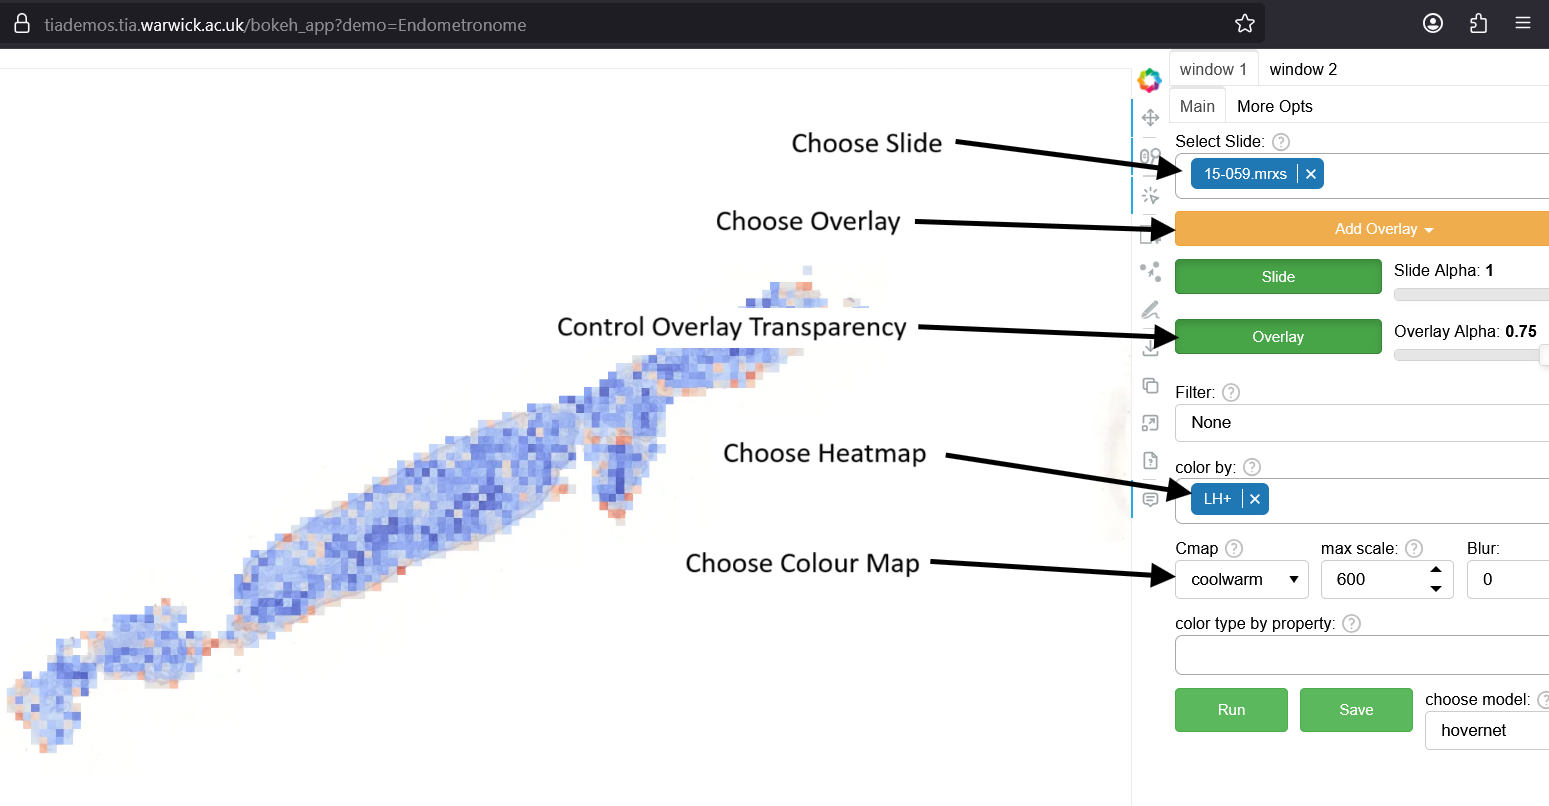
How to Use The Visualisation Tool
- Select the slide at the top-right of the window.
- Use the "Add Overlay" button to choose output for viewing.
- Switch heatmaps with the 'color by' selector.
- Red indicates high predictions; blue indicates low (in default coolwarm color map)
- Adjust overlay transparency with the 'overlay alpha' slider.
- See example slides below.